Wednesday, May 18, 2011

Plankton Lab

Introduction:

Plankton, or planktos ("wanderer" in greek), are miniscule living creatures that haunt the world's waters. They lack the means to move against the current or wind. Though there are numerous types of plankton, they are generally classified based on four different traits: diet, color, lifestyle, and size. They obtain their sustenance from either the sun (Phytoplankton) or from other living creatures (Zooplankton). Different colors include green (producer of 90% of Oxygen), brown, blue, red, and gold. Plankton also have a few different lifestyles they can be classified by. For example, holoplankton stay plankton for their entire lives. Common holoplankton include algae and jellyfish. Meanwhile, meroplankton remain true plankton for only part of their life. This class includes larval fish and barnacles. Finally, plankton are also classified by their size. Technically, there are six size classes that plankton are generally categorized in, but we'll only cover three for this lab. First up, megaplankton. They can grow bigger than 2 mm, which, for plankton, is huge. Next we have microplankton, spanning lengths from 0.06 mm to 0.5 mm. And, last but not least, we have ultraplankton, which never exceed 0.005 mm.

Question:

What is the diversity of Plankton in South Maui?

Hypothesis:

Though we may find it difficult to accurately identify some of the different species, I believe we will be able to identify at least 30 different kinds of plankton.

Prediction:

If my hypothesis correct, then we will be able to categorize at least thirty different types of plankton in water samples taken from South Maui beaches.

Materials:
  • Plankton net
  • Vial
  • Jars
  • Journal & writing utensils
  • Microscope
  • Microscope slides & cover slips
  • Plankton identification book
  • Thermometer
  • pH testing kit
  • Phosphate testing kit
  • Nitrates testing kit
  • Dissolved oxygen testing kit
  • Turbidity testing kit
Procedure:

Thermometer/pH Tester
  1. Turn device on.
  2. Remove cap.
  3. Submerge tip in seawater.
  4. Read and record data displayed for pH levels and temperature.
  5. Replace cap and turn device off.
Phosphates/Nitrates/Dissolved Oxygen/Turbidity
  1. Fill vial with seawater sample.
  2. Place tablet from kit inside vial.
  3. Shake well for approximately five minutes.
  4. Compare the water's color with chart inside kit.
  5. Record results.
Collecting Plankton Samples
  1. Go to area where you want to take sample.
  2. Drag plankton net firmly through open water for approximately five minutes, avoiding coral and barnacles.
  3. For the small net, simply reach inside net and carefully remove sample container.
  4. For the medium sized net, place a jar under the capture jar then carefully uncap the capture jar
  5. For large net, squirt water through the fine mesh and allow plankton to fall into collection jar
Microscope:
  1. Plug microscope into power source and turn on backlight.
  2. Carefully place seawater samples onto slides. Place slides on microscope observation tray.
  3. Adjust focus and position of microscope for the clearest view of the plankton.
  4. Look for plankton in the water, particularly in clusters of dirt or sand.
  5. Record and identify all plankton types you see.
  6. Power down and carefully put microscope away.

Proscope:

  1. Take proscope out of case, set up near computer.
  2. Plug into computer.
  3. Locate proscope program on computer and open it.
  4. Pour small sample of seawater into half a petri dish. Place dish under proscope.
  5. Focus proscope on seawater.
  6. Search the sandy clusters for plankton.
  7. Record and identify all plankton types you see.
  8. Clean off lens, power down and put away carefully.

Data:

Temperature: 20.4 degrees Celcius
Salinity: 26 parts per thousand
Dissolved Oxygen: 0
Phosphates: 4 parts per thousand
Nitrates: 2 parts per thousand
pH: 8.09 pH
Turbidity: 0
Tide: Low
Wind: Gentle

We were able to loosely identify only six species of plankton. We did see others, but were unable to classify them.

Conclusion:

Unfortunately, this lab did not even come close to proving my hypothesis. In response to a question about the number of plankton species in South Maui, I confidently predicted that we would be able to identify at least thirty. In the end, we were only able to identify six. However, I feel sure that under different circumstances, we could have easily proved my hypothesis. For example, we had very limited time to actually search our samples for different plankton species, and equally limited time to actually search the identification books and make conclusions about them. With more time, we most likely could have found more species nestled deep in the sand clusters and incorporated them into our conclusions. Secondly, when you are working with creatures at the microscopic level, there are bound to be mistakes made. The proscope I was using didn't exactly yield a clear image, and occasionally we were forced to guess which species a particular plankton might belong to. There is always the possibility that we counted the same species twice because we were looking at it from different angles, or that we didn't count a different species simply because it looked similar to one we already had identified. It didn't help that all we had with which to identify the plankton were booklets containing a single, black-and-white rough drawing of each species. With better resources to refer to, I feel we could have more accurately drawn a conclusion for this lab. However, I did learn a lot during this lab, and I also enjoyed myself. I always have fun using microscopes in the classroom. I just can't resist finding out how random objects look zoomed in x200 . . .

I mean . . . who can? :)

In a somewhat unrelated topic, I am positive that we misread the results in the dissolved oxygen test. How am I so certain? Well, if our seawater sample's dissolved oxygen content had really been zero, we would have found no living plankton in the sample later on (they need to breathe too). Obviously, this was a mistake. Fortunately, the dissolved oxygen content is basically irrelevant to our conclusion, so we can all move along now.

Saturday, April 23, 2011

Beach Profiling

Introduction:

Beach profiling is a great way to study beach erosion. If you take multiple beach profiles, you can very effectively compare the size and shape of sand dunes over time. The results of beach profiling can be affected by many factors. For example, if there are ditches or cliffs in the dunes, they will show in the final profile. Over time, beaches can be shaped by a variety of factors, including wind, waves, and tide. Rain often erodes beaches, changing their shape. Other things affecting the beach's sand levels are human activity such as walking or driving along the beach. The very successful dune restoration project at our specific beach will also undoubtedly affect profiles as well; if we had taken these profiles before the restoration project was initiated, the beaches would have been much flatter.

Procedure:

1. Collect materials (Rise tool, run tool, compass, GPS, data sheet, transect line, writing utensil) and go to beach.

2. Find a point on a sand dune a little ways inland, and take the latitude/longitude coordinates of that point using the GPS (This will be Point A). Record data.

3. Starting at Point A on the dune, lay the transect line exactly perpendicular to the shoreline, going towards the water. BE AS PRECISE AS POSSIBLE.

4. Using the compass, take a reading from Point A telling which exact direction/degree the transect line is running. Record data.

5. Place the run tool firmly on the ground at Point A, pointing down the transect line. Use the level to make it exactly even.

6. Brace the rise tool on the ground at the other end of the run tool (this is Point B), and use the level to even it out.

7. Look where the run tool points to on the rise tool. The number it touches is the rise from point A to point B. If the dune slopes upward, it should be a negative number. Record the rise as well as any notable features included between the two points.

8. Move the foot of the run tool to the foot of the rise tool and switch them carefully, making sure to use the exact same point. Make sure the run tool is still even and pointing along the transect line. Move the rise tool to the other end of the run tool and, using the same method as step 7, collect data.

9. Repeat step 8 until you reach the waters edge, then repeat the same data-collecting process into the water. Continue until you reach the “foot” of the beach, a small dip in the sand just offshore (almost all beaches have them).

Pictures:

Here we are taking the GPS coordinates of our starting point (step 2).

Here we are taking the actual data (step 7). We're getting closer to the foot of the beach with every step!

Results:

Beach Profile

Here we have the slope of the beach at transect 2. This should be pretty close to the actual shape of the dune, although if we were to be perfectly precise, this graph would be stretched dramatically length-wise. Overall though, it's a good representation of the beach . . .

Current Map:

. . .here we have a current map of south Kalepolepo. We carefully tossed a special scientific floating tool (a rotten guava) into the ocean and recorded its progress through the water, noting the shape and speed of the current. It took us a few times to do this correctly; we kept losing sight of our guavas and having to start over. This is the final result.

Saturday, April 9, 2011

Sandman Lab

Introduction: Sandy beaches form many of the world's seashores, dividing the vast ocean from the land. This sand can come in many consistencies and colors. It can be anything from powdery to gravelly, raning in color from yellow to red to black to green. Sand can come from two different sources, living and non-living. Biogenic sand comes from sources that once lived: coral, skeletons, shells, etc. Detrital sand originates from nonliving sources: rocks and minerals. And though you may not be able to tell these two types of sand apart just by looking, there is a way to check. If you mix biogenic sand - which contains calcium carbonate (CaCO3) - and vinegar (CH3COOH), you get a number of results. Namely water (H20) calcium acetate (Ca(CH3OOH)2), and carbon dioxide (C02). If the sand is indeed biogenic, the carbon dioxide will cause the sand to bubble slightly and make a crackling sound. If neither of these reactions happens, then the sand is detrital. Question: Are there beaches of both biogenic sand and detrital sand in South Maui, and if so, which are which? Hypothesis: I believe that the ever-popular Big Beach consists primarily of biogenic sand. There is a dead coral reef that runs parallel to the shoreline, and the infamous powerful waves at Big Beach could easily be responsible for eroding it. The sand is also very light and fine, traits often found in biogenic sand. Meanwhile, the sand at the Makena Black Sand Beach should be at least partially detrital, because of the large, worn cliffs on one side of the beach. If my hypothesis is correct, then we should observe a chemical reaction between the vinegar and the Big Beach sand, and a much smaller reaction with the Black Sand Beach sand. Materials:

  • Sand samples

  • Acetic acid (vinegar) (("the good stuff"))

  • Clipboard

  • Writing utensil

  • Data sheet

  • Small beaker

  • Bulb syringe

Procedure:


  1. Go to beaches outlined in hypothesis

  2. Observe beach areas for clues as to whether the sand will be detrital or biogenic, write observations on data sheet

  3. Collect sand sample (make sure to mark which beach it is from)

  4. Return to lab with multiple sand samples

  5. Pour first sand sample into small beaker, only enough to ensure it covers the bottom

  6. Carefully squeeze exactly 20 drops of vinegar (one milliliter) onto the sand using the bulb syringe

  7. Watch the sand for light bubbling and listen carefully for crackling sounds (if you can see or hear these reactions, then the sand is biogenic)

  8. Record observations

  9. Repeat steps 6-8 with second sand sample

  10. Compare and conclude

Observations:


"Big Beach"


The sand at Big Beach is mostly very light and very fine. When you look closely, you can observe small pieces of shells mixed in, along with a few black and red colored grains of sand. There is a dead coral reef that runs parallel to the shore here, and it is likely that the large shorebreak at this beach contributes greatly to its erosion. At either end of the beach, there are relatively small lava-rock outcroppings, but neither are very prominent.


The southern half of Big Beach.

The northern half of Big Beach.

"Black Sand Beach"


The sand here is multicolored, containing everything from black to red to white to pink sand. However, it is mostly red and dark grey, like the large cliffs on its left side. Though there is a large reef a little ways offshore, it is mostly alive and thus doesn't erode much. There are quite a few white shell fragments mixed in with the dark sand, which is relatively fine but not as fine as that of Big Beach.


The cliffs on the southern half of the beach. They likely contribute to the darkness of the sand.


Data:

Big Beach:

Sand: Very light yellow-brown. Fine and powdery.

Reaction: Small bubbles and light crackling.

Black Sand Beach:

Sand: Dark grey with grains of red and light sand. Slightly coarser than Big Beach's.

Reaction: Small bubbles and light crackling.

Conclusion:

The chemical test revealed some interesting results. Though the sand colors and consistency were nearly opposite each other, both samples proved to contain significant amounts of biogenic sand. I predicted that the Black Sand Beach sample would consist at least partially of biogenic sand, but I assumed that portion of the sample would be minimal. I hoped that we would be able to differentiate the two samples by comparing the volume and intensity of the crackling and bubbling when we added vinegar to them. Theoretically, the sample with less biogenic sand should have a smaller reaction. Either this is not the case at all, or both Big Beach and the Black Sand Beach have equal amounts of biogenic material in their sand makeup (extremely doubtful.) I still believe that black sand is mostly detrital, but unfortunately this particular method of testing neither confirmed nor disproved this hypothesis.

Possible Sources of Error:

There are not many possible sources of error in this particular experiment; I can only think of two. Firstly, when collecting sand samples, we may have collected from sand deposits on the beach that, for some reason or other, contained more biogenic material than the rest of the beach. This, however, is quite doubtful, since generally sand is well balanced. Second (and more plausible), we could have accidentally applied more than a millileter of vinegar onto black sand beach sample, thus altering the intensity of the reaction and making it equal to that of the almost fully-biogenic Big Beach sand.

Tuesday, March 29, 2011

A Three Hour Tour...

Actually, it was only a two hour tour. And we only spent a quarter of that time actually collecting data for our whale lab. But I digress...
Quite a while ago, we wrote up the introductions for a lab involving the famous Hawaiian humpback whales. We got to make our own essential questions predictions, and I thought that there would be more competing male pods later on in the season. I reasoned that as time passed, more pregnant female whales would give birth and be ready to mate again, and thus competition between males for a mate would be more intense. In the last post, we counted the number of competing male pods early in the season (approximately zero). I was optimistic about proving my hypothesis correct; I technically only had to see a single competing male pod on our next outing for it to work. Unfortunately, it wasn't to be. One fine day, we set sail on the sparkling blue ocean, after listening to a fascinating presentation by an expert on marine life. We all had our pens and clipboards out, eager to start counting. My teacher started the stopwatch, explaining that to keep data consistent we would only count for the same amount of time we had spent on the last whale observation outing. "You have half an hour," he said. "Go!"


By the end of the half an hour, I was extremely depressed. Once again, not a single competing male pod was spotted within the time limit. To make matters worse, we saw three different pods only minutes after the observation time ended. Typical. Unfortunately, science is not flexible. The assignment called for me to count only pods within the assigned time frame, and that is what I have to do. Anyway, here is compulsory a graph comparing the number of competing male pods we counted at different times in the season. Pretty boring, but what's one to do? Here is a slightly more interesting graph that details the number of whales seen altogether. Apparently, whales are more common later in the season, which could account for all the competing male pods we saw on the second outing (even though they were outside of the observation time limit).

Hopefully next time I'll have more luck. But for now, I'll be satisfied with the fact that my hypothesis is probably actually correct anyway, even if this specific data range doesn't authenticate my claim. Besides, the outing was super fun either way. What time we didn't spend watching for whales, we spent beating each other with giant toy stuffed whales. Good times . . . good times.


~ Adam

Wednesday, January 26, 2011

Whale Wonderland


AOOOOOOOOOOBLLLLLLEEEEEEEEOOOOOOAAAAAAAAAAA!!!!!!!!


What? You don't understand me?

...

Humph. Apparently you don't speak humpback whale. And that's a bloomin' shame, considering how amazing these animals are. They are some of the largest living creatures in the world, weighing up to 50 tons and growing up to 52 feet long. They make one of the longest migrations in the animal kingdom, swimming from Alaska to Hawaii and back every year. Despite their size, whales are quite difficult to study, and we really don't know that much about them. For this reason, any we can safely conduct on them is valuable.

For this particular unit in science class, I opted to study whether there would be more competing male humpback whale pods earlier or later in the season. I hypothesized that we would see more later in the season, since by then more females would have arrived and given birth, rendering themselves eligible for mating once again.

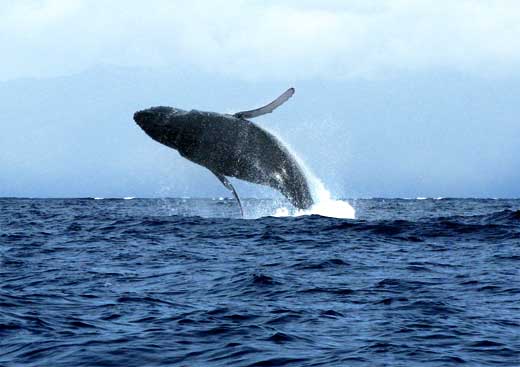
This lab requires the counting of humpbacks during two different times in the whale season; early and late. We recently set out on our "early" adventure, clipboards in hand, eager to spot a whale or two. Fortunately, the weather treated us well on this particular day (apparently, it had grown tired of continually forcing us to postpone our excursion). Unfortunately, whale activity was down. We did manage to catch glimpses of a few single whales, and some of us saw the splash as a particularly large whale breached and smashed back down. No one in our class saw any competing male pods though. Oh well. I suppose this means that if we see a single competing male pod on our next trip, my hypothesis will *technically* be proven correct. I'll need to make sure and account for all possible errors though (and there are many).

AAAAAAAALLLLLLLLLOOOOOOOOOOOOOHHHHHHHUUUUUUUAAAAA

(Aloha in whale)

~~~~~~~~~~~~~~~~~~~~~~~~~~~~~~~~~~~~~~~~~~~~~~~~~~~~~~~~~


Shown here is a student using a clinometer to estimate how far a certain whale is from shore. You do this by using the following steps;
  1. Find your elevation using a GPS.
  2. Wait for a whale.
  3. Once a whale appears, look through the tube on the clinometer (as if it were a telescope) until you spot him. The student shown above is in the process of finding the whale.
  4. Have a partner read the angle shown on the clinometer while you hold the whale (or, if he submerges, the spot he was in) firmly in your sights.
  5. Plug all your variables into the following equation using a scientific calculator.
Elevation x Tangent of (Angle) = Dista
nce From Shore

6. This will give you the whale's approximate distance from shore. Make sure to write it down!

~~~~~~~~~~~~~~~~~~~~~~~~~~~~~~~~~~~~~~~~~~~~~~~~~~~~~~~~~

YAAAAAAAAAAAA SCIENCE!


~ Adam

Friday, December 17, 2010

Phylum Fun

There are countless living creatures in our world. Their diversity is nearly unfathomable, and every type of animal has different characteristics than every other type. It would be nearly impossible to clearly tell them apart if it weren't for biological classification; a system that neatly organizes all living creatures into increasingly specific categories based on their traits. This way, we can identify creatures based on their classification in this system. The lab we conducted for this particular unit in Science class involved the study of nine different types of marine Phyla (the second broadest category in biological classification), which were as follows;
  • Porifera: Sponges
  • Cnideria: Jellyfish, sea anemones, corals
  • Platyhelminthes: Flatworms
  • Nematoda: Roundworms
  • Annelida: Segmented worms
  • Mollusca: Gastropods, bivalves, cephalopods
  • Arthropoda: Crustaceans, insects, arachnids
  • Echinodermata: Sea stars, brittle stars, sea urchins
  • Chordata: Fish

We originally set out to find out which marine Phyla are present at the tide pools of South Maui, and which are most represented in diversity and quantity. Based on previous observations and logic, we hypothesized that the most common Phylum would be Mollusca. Other Phyla we expected to see in some quantity included Arthropoda, Chordata, Echinodermata, and possibly Cnideria. On December 1st, our whole class trudged out to the South Kihei Tidepools and collected data....and with every new snail we counted, our hypothesis was strengthened further. In the end, we counted 1024 more individuals in the Mollusca Phylum than in the next most common Phylum, Arthropoda. Sightings of species from Phyla other than these two were quite rare. Somewhat surprisingly, not even a single Echinoderm was spotted. For the most part however, our hypothesis was correct, and this lab was a success. Of course, there is always the possibility that our data could have been incorrect. We easily could have miscounted the number of individual specimens in our research areas, and the tide could have affected the number of creatures we could see to count. But as with all things, science is not perfect. We did our best, and the data appears consistent.

What I enjoyed the most about this lab was that we had an opportunity to go outside and conduct real field research. While we were collecting data, we were stopped by interested citizens and asked questions, which really gave us a chance to put our best foot forward for the community and set a good impression of our school. Our school actually doesn't necessarily on what we may need to know for every history or math test thrown at us, but what will be of use to us in later life. It's these 21st century skills that will benefit us as we graduate from high school and move on with our lives, and this lab was a great chance to practice them.

~ Adam

(Collecting Data)

Wednesday, November 17, 2010

Geocaching Joy

Greetings, earthlings.

Our post today concerns a super fun, ultra-awesome, worldwide scavenger hunt known as geocaching. People go to this website and search for geocaches (small stashes of random items, usually) near them. But here's the catch; you are only given GPS coordinates and some abstract hints about where the geocaches are. To find your prize, you have to enter the coordinates into a GPS, which will then direct you to your destination. Finding these caches is pretty easy and lots of fun, especially since geocaches are hidden all over the world and you can find them wherever you go.

During this section of our science class, we learned more than just geocaching, though. We learned many other useful functions of the GPS unit, including everything from finding your way home to rescuing missing people. We also learned some about how these high-tech compasses/maps actually work; with the assistance of satellites, they can track down the exact locations of nearly anything, nearly anywhere on the face of the planet.

Our group decided to put this to the test, and went on a geocaching expidition ourselves. It was fun, but in all honesty, not very productive. I mean, we went on two seperate trips, and the first time we didn't find anything. We chose a cache that was too far away, and by the time we got there it was already time to start heading back. The second time we were slightly more successful. We actually visited five different places that claimed to host geocaches. However, even with all our searching, we only managed to actually locate one geocache. Our excuse was that people may have stolen the geocaches themselves, but I think we just didn't prepare very well. No one had even read the clues; we only had the coordinates. Oh well, at least we achieved something, no matter how small. And something is better than nothing it all! ;D

Peace out.

(Us hunting geocaches:)


(And here's a pic of the one geocache we actually found.)


~ Adam